Fig. 5
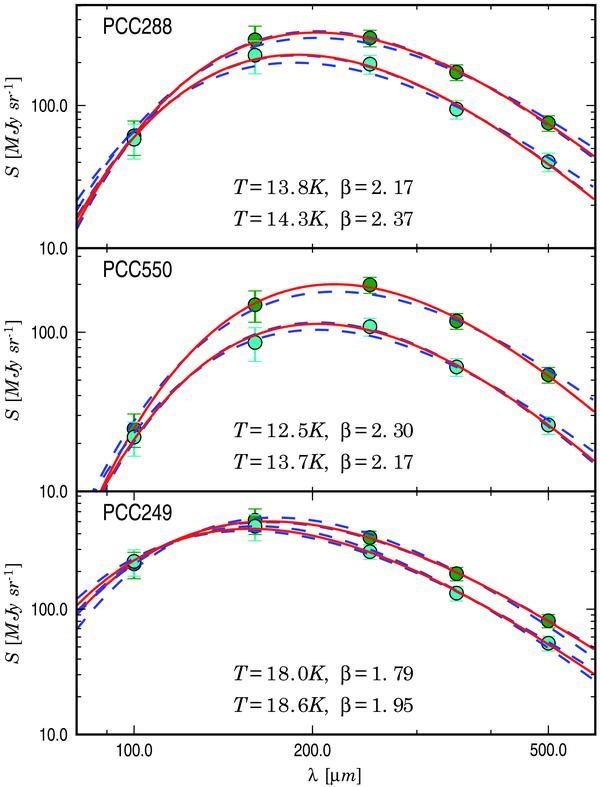
Spectral energy distributions for selected positions. The measurements correspond to a single pixel at the centre of the circles shown in Fig. 4 (after convolution to the resolution of the 500 μm observations). The temperature and the spectral index are quoted in the frames, the first values corresponding to the upper SED curve. The dashed lines are the fits with a constant spectral index value of β = 1.7 or β = 2.3.
Current usage metrics show cumulative count of Article Views (full-text article views including HTML views, PDF and ePub downloads, according to the available data) and Abstracts Views on Vision4Press platform.
Data correspond to usage on the plateform after 2015. The current usage metrics is available 48-96 hours after online publication and is updated daily on week days.
Initial download of the metrics may take a while.