Fig. 7
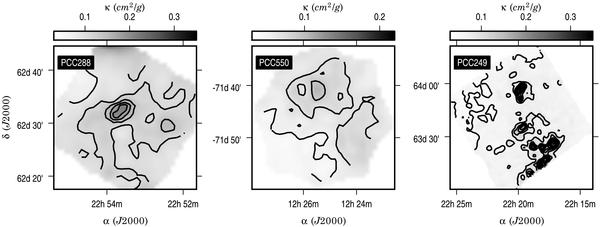
Maps of the dust opacity derived from the comparison of the NIR extinction maps and SED fits with a fixed value of the spectral index, β = 2.0. The values are given for 250 μm and relative to the total ISM mass. The contours are drawn starting with the value of 0.05 cm2 g-1 and with a step of 0.02 cm2 g-1 (PCC550) or 0.03 cm2 g-1 (PCC288 and PCC249).
Current usage metrics show cumulative count of Article Views (full-text article views including HTML views, PDF and ePub downloads, according to the available data) and Abstracts Views on Vision4Press platform.
Data correspond to usage on the plateform after 2015. The current usage metrics is available 48-96 hours after online publication and is updated daily on week days.
Initial download of the metrics may take a while.