Fig. 13
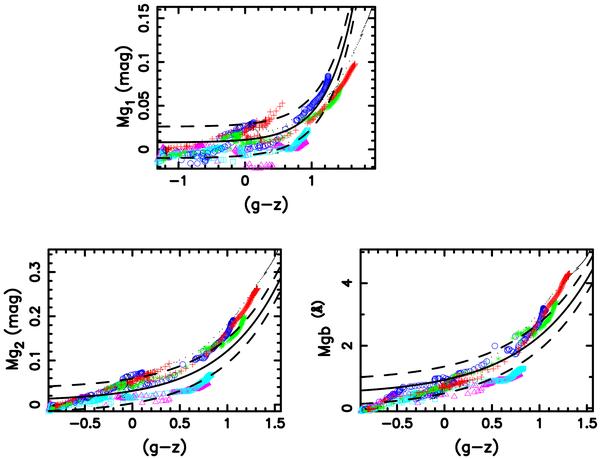
Comparison of correlations between absorption line indices and colours derived from the observational data and BC03 model, respectively. Points show the correlations derived from BC03 model. Six kinds of points denote stellar populations wit metallicities Z = 0.0001,0.0004,0.004,0.008, 0.02, and 0.05. Solid lines show the best fits to correlations between observational absorption line indices and colours of early-type galaxies. Dashed lines show the 1σ scatters of correlations derived from observational data. Three panels are for three metallicity sensitive indices, i.e., Mg1, Mg2, and Mgb, respectively.
Current usage metrics show cumulative count of Article Views (full-text article views including HTML views, PDF and ePub downloads, according to the available data) and Abstracts Views on Vision4Press platform.
Data correspond to usage on the plateform after 2015. The current usage metrics is available 48-96 hours after online publication and is updated daily on week days.
Initial download of the metrics may take a while.