Fig. 2
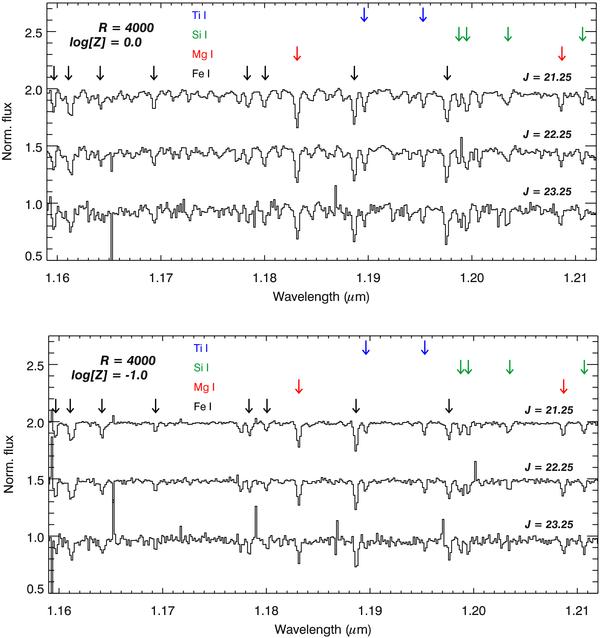
Examples of simulated R = 4000 spectra for J = 21.25, 22.25, and 23.25 (with seeing of  , ZD = 35°, and the “good” NGS configuration). Upper panel: solar metallicity simulations (log [Z] = 0.0); lower panel: metal-poor simulations (log [Z] = −1.0). Identified lines, from left-to-right by species, are: Ti i λλ1.1896, 1.1953 μm; Si i λλ1.1988, 1.1995, 1.2035, 1.2107 μm; Mg i λλ1.1831, 1.2087 μm; Fe i λλ1.1597, 1.1611, 1.1641, 1.1693, 1.1783, 1.1801, 1.1887, 1.1976 μm. Residuals from the sky OH lines can be seen in places, e.g. the emission “spikes” in the simulated metal-poor spectrum for J = 23.25.


Current usage metrics show cumulative count of Article Views (full-text article views including HTML views, PDF and ePub downloads, according to the available data) and Abstracts Views on Vision4Press platform.
Data correspond to usage on the plateform after 2015. The current usage metrics is available 48-96 hours after online publication and is updated daily on week days.
Initial download of the metrics may take a while.