Fig. 8
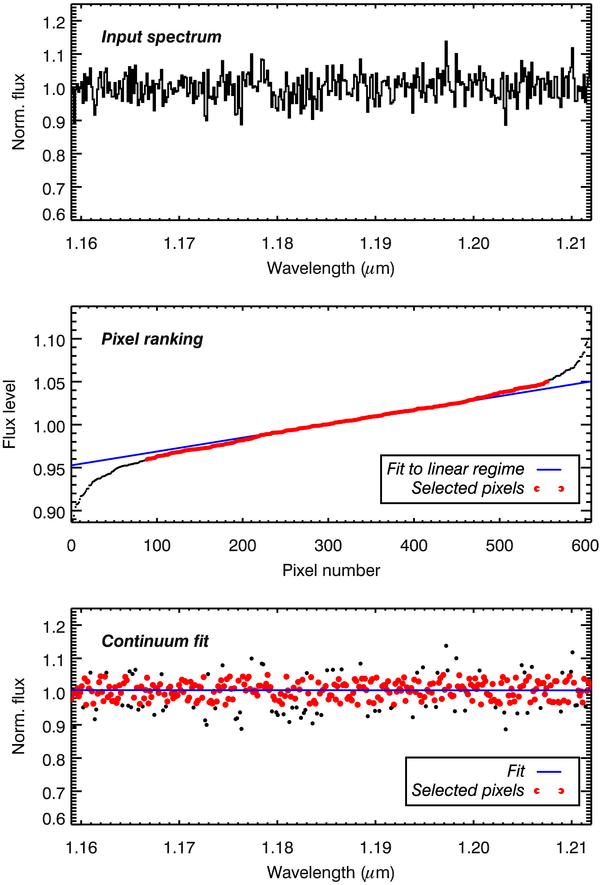
Illustration of the continuum-fitting procedure for a spectrum of pure Gaussian noise. Top panel: input spectrum with S/N = 50. Centre: input spectrum plotted in order of increasing pixel flux (the “pixel ranking” spectrum). The blue line is a fit to the linear regime, with pixels selected as part of that regime ( ± 1σ of the mean) in red. Bottom: input spectrum, with the pixels selected for continuum fitting indicated by red dots. The resulting continuum fit is shown by the solid blue line.
Current usage metrics show cumulative count of Article Views (full-text article views including HTML views, PDF and ePub downloads, according to the available data) and Abstracts Views on Vision4Press platform.
Data correspond to usage on the plateform after 2015. The current usage metrics is available 48-96 hours after online publication and is updated daily on week days.
Initial download of the metrics may take a while.