Fig. 10
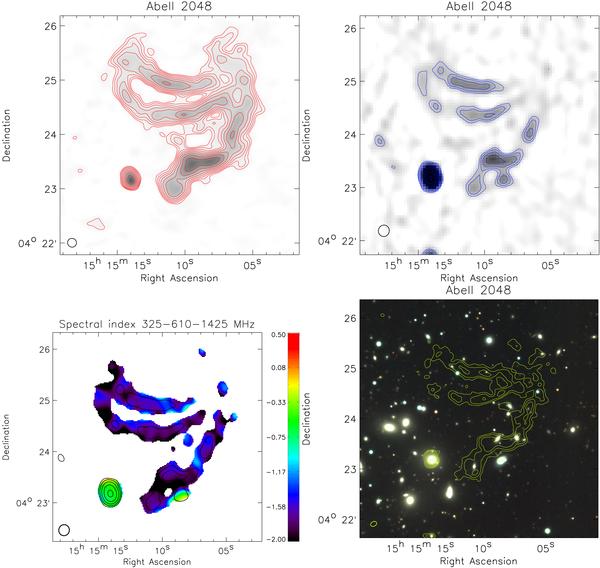
Tot left: GMRT 325 MHz map. Contour levels are drawn as in Fig. 1. Top right: VLA 1425 MHz map. Contour levels are drawn as in Fig. 1. Bottom left: power-law spectral index fit between 325, 610, and 1425 MHz. Contours are from the 1.4 GHz VLA image and drawn as in Fig. 2 (left panel). The resolution is 13.0″ × 12.4″. Bottom right: optical WHT color image for Abell 2048. GMRT 610 MHz contours are overlaid in yellow. The beam size is 7.6″ × 5.4″. Contour levels are drawn as in Fig. 5.

Current usage metrics show cumulative count of Article Views (full-text article views including HTML views, PDF and ePub downloads, according to the available data) and Abstracts Views on Vision4Press platform.
Data correspond to usage on the plateform after 2015. The current usage metrics is available 48-96 hours after online publication and is updated daily on week days.
Initial download of the metrics may take a while.