Fig. 2
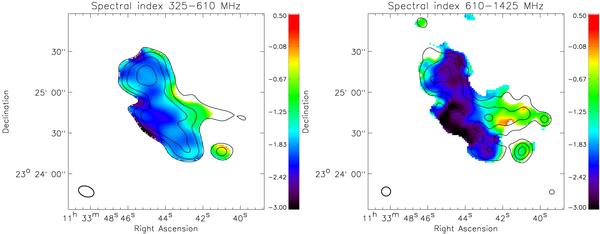
Left: spectral index map between 325 and 610 MHz at a resolution of 11.75″ × 7.65″. Contour levels are from the 325 MHz GMRT image and drawn at levels of [1,2,4,8,...] × 6σrms. Right: spectral index between 610 and 1425 MHz. Contour levels are from the 1425 MHz VLA image and drawn at levels of [1,2,4,8,...] × 5σrms. The beam size is 6.7″ × 6.7″.
Current usage metrics show cumulative count of Article Views (full-text article views including HTML views, PDF and ePub downloads, according to the available data) and Abstracts Views on Vision4Press platform.
Data correspond to usage on the plateform after 2015. The current usage metrics is available 48-96 hours after online publication and is updated daily on week days.
Initial download of the metrics may take a while.