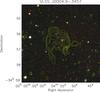
Fig. 7
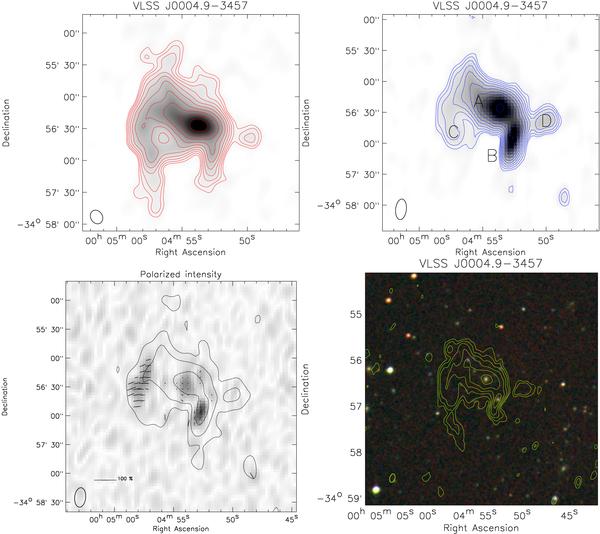
Top left: GMRT 325 MHz map. Contour levels are drawn as in Fig. 1. Top right: VLA 1425 MHz map. Contour levels are drawn as in Fig. 1. Bottom left: VLA 1425 MHz polarization map. Total polarized intensity is shown as grayscale image. Vectors refer to the polarization E-vectors, with their length representing the polarization fraction. A reference vector for a polarization fraction of 100% is shown in the bottom left corner. The polarization fractions were corrected for Ricean bias (Wardle & Kronberg 1974). No polarization E-vectors were drawn for pixels with a SNR less than 3 in the total polarized intensity map. Contours show the total intensity image (Stokes I) at 1425 MHz. Contour levels are drawn at [ 1,16,256,4096,... ] × 0.147 mJy beam-1. Bottom right: optical POSS-II color image for VLSS J0004.9 − 3457. GMRT 610 MHz contours are overlaid in yellow. The beam size is 6.4″ × 4.3″. Contour levels are drawn as in Fig. 5.
Current usage metrics show cumulative count of Article Views (full-text article views including HTML views, PDF and ePub downloads, according to the available data) and Abstracts Views on Vision4Press platform.
Data correspond to usage on the plateform after 2015. The current usage metrics is available 48-96 hours after online publication and is updated daily on week days.
Initial download of the metrics may take a while.