Fig. 5
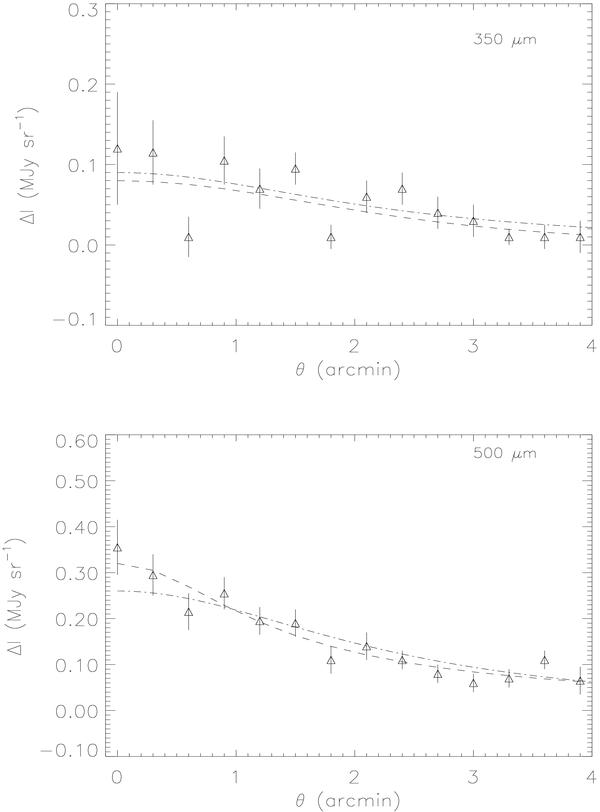
The SZE brightness radial profile of the Bullet cluster at 350 μm (upper panel) and at 500 μm (lower panel). The dot-dashed curve corresponds to the form of the brightness profile produced by a thermal plasma adopting the structure parameters given by Halverson et al. (2009), with arbitrary normalization. The dashed curve corresponds to the fit to the data obtained using a model as in Eq. (7), with S0 = 0.08 ± 0.02 MJy sr-1, θc = 3.96 ± 1.84 arcmin, and q′ = 2.7 ± 1.8 for 350 μm, and S0 = 0.32 ± 0.04 MJy sr-1, θc = 1.05 ± 0.12 arcmin, and q′ = 0.6 ± 0.3 for 500 μm.
Current usage metrics show cumulative count of Article Views (full-text article views including HTML views, PDF and ePub downloads, according to the available data) and Abstracts Views on Vision4Press platform.
Data correspond to usage on the plateform after 2015. The current usage metrics is available 48-96 hours after online publication and is updated daily on week days.
Initial download of the metrics may take a while.