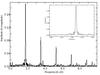
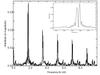
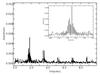
Fig. 4
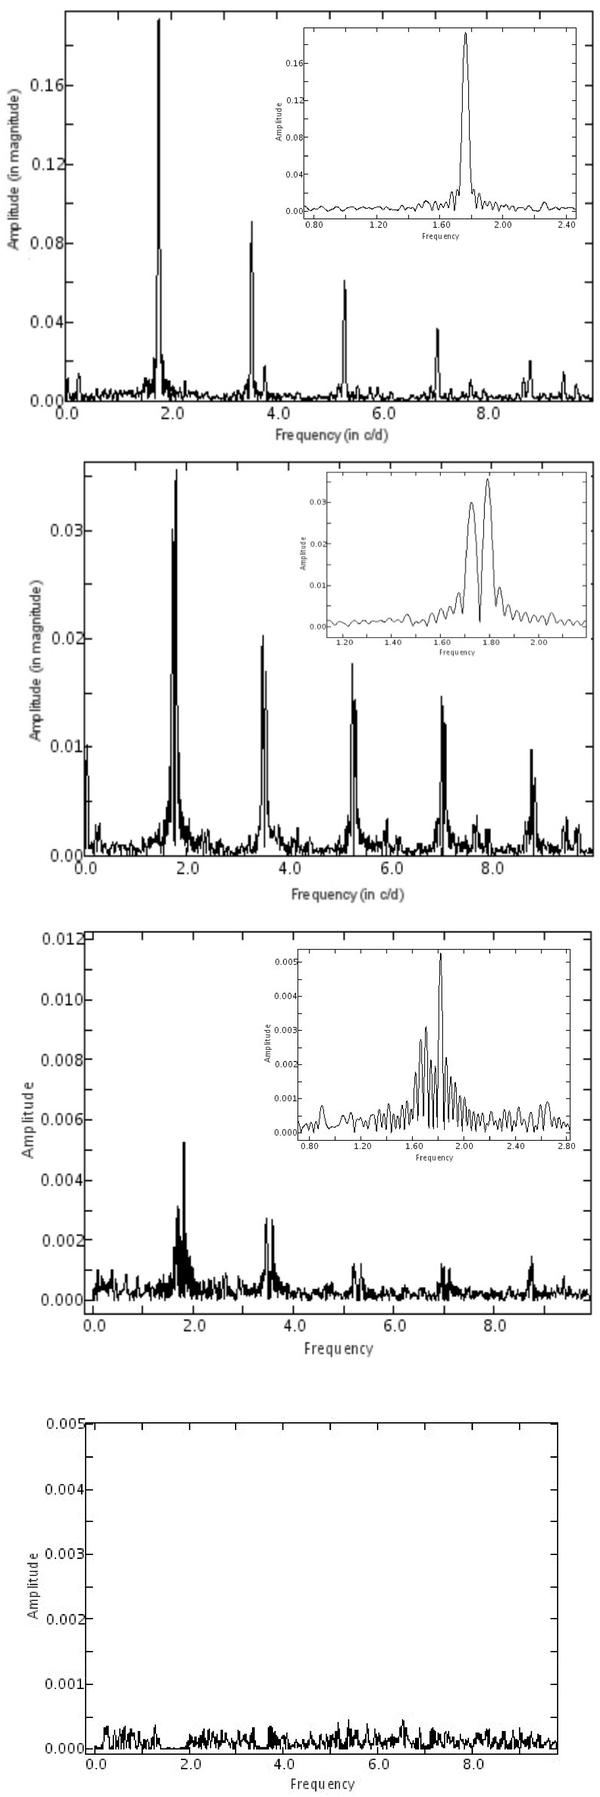
The upper panel shows the amplitude spectrum at the first Blazhko period of CoRoT ID 0105288363. The other three panels are the residual spectrum after prewhitening with the main frequency and its harmonics, the triplets and its harmonics and when all frequencies in Table 2 are removed. The insert panels show the enlargements centered on the main frequency, triplets and quintuplets.
Current usage metrics show cumulative count of Article Views (full-text article views including HTML views, PDF and ePub downloads, according to the available data) and Abstracts Views on Vision4Press platform.
Data correspond to usage on the plateform after 2015. The current usage metrics is available 48-96 hours after online publication and is updated daily on week days.
Initial download of the metrics may take a while.