Free Access
Fig. 1
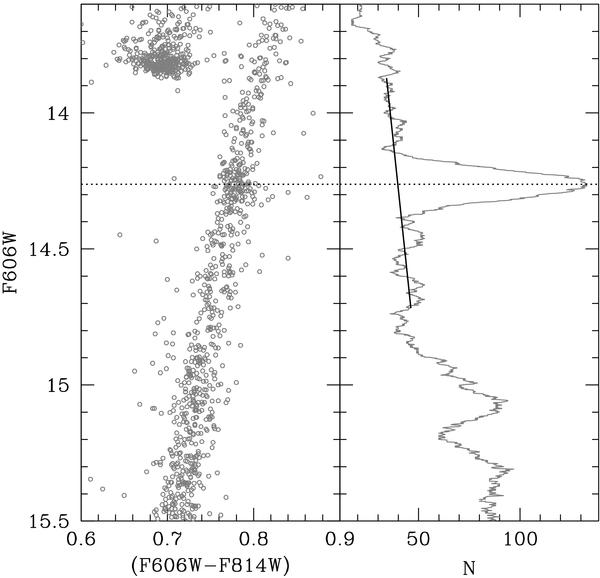
Left panel: CMD of NGC 104. Right panel: the LF around the bump region. The solid line shows the continuum used for the bump determination (see text for more details), while the dotted line marks the bump location.
Current usage metrics show cumulative count of Article Views (full-text article views including HTML views, PDF and ePub downloads, according to the available data) and Abstracts Views on Vision4Press platform.
Data correspond to usage on the plateform after 2015. The current usage metrics is available 48-96 hours after online publication and is updated daily on week days.
Initial download of the metrics may take a while.