Fig. 9
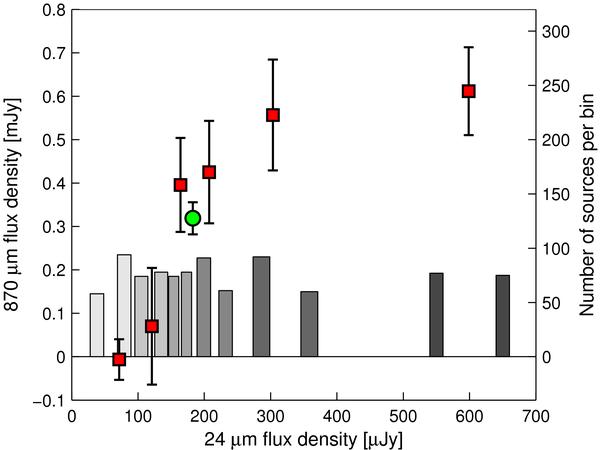
Results from the stacking analysis in MS 1054-03, AC 114 and Abell 2744, as described in Sect. 5.2. Boxes: measured flux density in the maps when dividing the 24 μm positions into six equal parts, and stacking them. The stacked flux densities are measured by fitting a circular Gaussian to the maps, except in the lowest two 24 μm flux bins where no significant stacked signal was detected, and we instead measured the flux density in a circular aperture with the diameter of the beam FWHM. Circle: the stacked signal for all three clusters. Shaded bars: histograms indicating the distribution of 24 μm flux densities within each of the six flux bins. Each of the bins have two bars and the different shades of gray discriminate between them. In the highest flux bin the rightmost bar includes all the 24 μm sources with flux densities larger than 650 μJy. All flux values were corrected for gravitational magnification.
Current usage metrics show cumulative count of Article Views (full-text article views including HTML views, PDF and ePub downloads, according to the available data) and Abstracts Views on Vision4Press platform.
Data correspond to usage on the plateform after 2015. The current usage metrics is available 48-96 hours after online publication and is updated daily on week days.
Initial download of the metrics may take a while.