Fig. 3
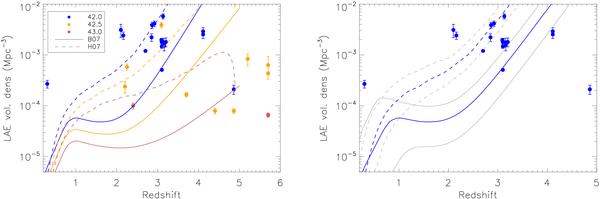
LAE volume densities as a function of redshift and limiting Lyα luminosity. The datapoints are collected from 18 publications, searching for LAEs, with colour coding referring to the limiting Lyα luminosity in each survey (where [blue, yellow, red] have log Lyα [<42.25, 42.25 − 42.75, > 42.75] erg s-1). Models (see text) come from Bongiorno et al. (2007, B07) and Hopkins et al. (2007, H07). To the left, all measurements and the two models (with MB < −22.0) are shown to the different Lyα luminosity limits. To the right, only models and measurements to the faintest luminosity limits are shown, and instead the effect of varying the luminosity of the AGN is shown. For each model the grey lines show the predictions for MB < −20.0 (above the original line) or MB < −24.0 (below the original line).
Current usage metrics show cumulative count of Article Views (full-text article views including HTML views, PDF and ePub downloads, according to the available data) and Abstracts Views on Vision4Press platform.
Data correspond to usage on the plateform after 2015. The current usage metrics is available 48-96 hours after online publication and is updated daily on week days.
Initial download of the metrics may take a while.