Fig. 1
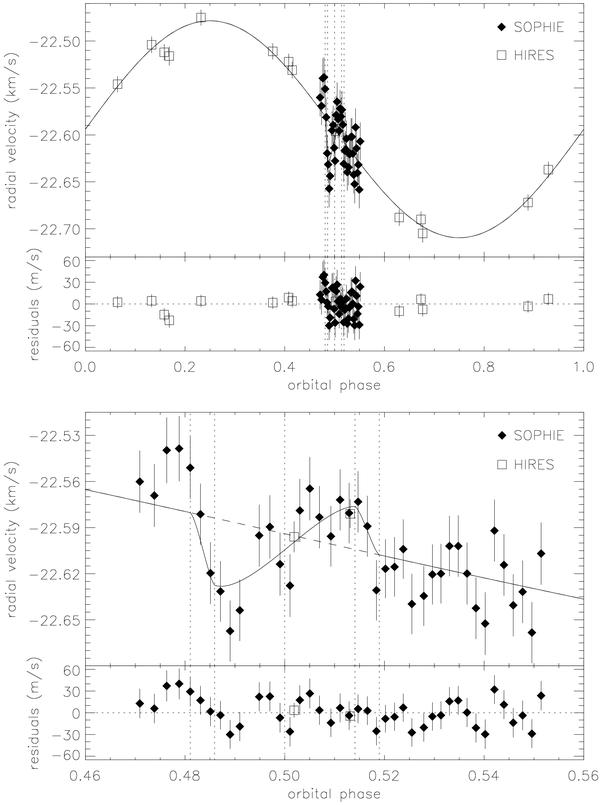
Radial velocity measurements of HAT-P-6 as a function of orbital phase. Filled diamonds represent the SOPHIE data (this paper), and open squares the HIRES data (N08). The lower panel zooms on the transit phases. The dashed line represents the Keplerian fit (ignoring the transit phases), while the solid line represents the final fit including the model of the Rossiter-McLaughlin anomaly. In each panel, the residuals of the final fit are plotted below the data. The vertical dotted lines show the times of mid-transit, first, second, third, and fourth contacts. The fitted values are Vsinis = 7.5 ± 1.6 km s-1 and λ = 166° ± 10°.
Current usage metrics show cumulative count of Article Views (full-text article views including HTML views, PDF and ePub downloads, according to the available data) and Abstracts Views on Vision4Press platform.
Data correspond to usage on the plateform after 2015. The current usage metrics is available 48-96 hours after online publication and is updated daily on week days.
Initial download of the metrics may take a while.