Fig. 1
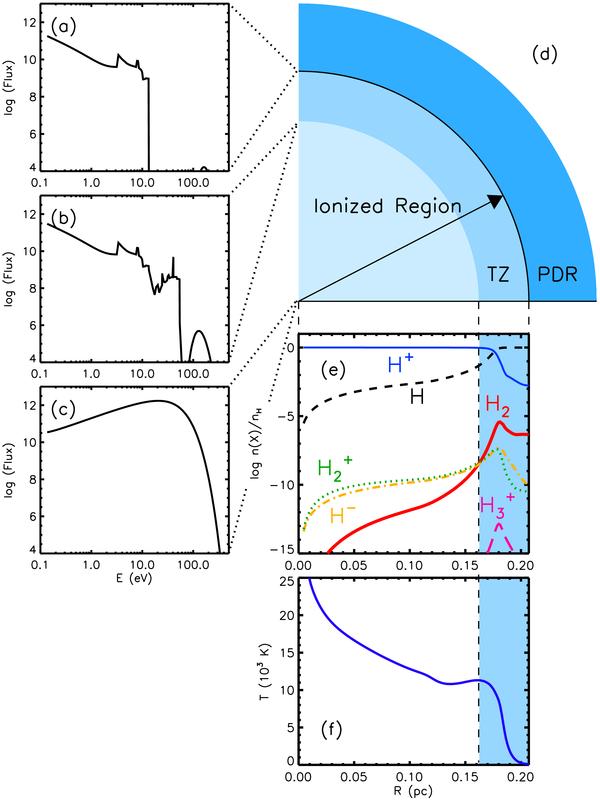
The standard PN model. a)–c) Ionizing continuum spectra in three different positions of the nebula, as indicated in the cartoon representing the ionization structure of the standard PN in panel d) (the PDR is not to scale). e) Radial density profile of H0, H+, H−, H2, H , and H
 in the ionized region. Densities are relative to the total density of H nuclei. f) Radial gas temperature profile in the ionized region. The blue band in both panels indicates the TZ. A color version of this figure is available online.
Current usage metrics show cumulative count of Article Views (full-text article views including HTML views, PDF and ePub downloads, according to the available data) and Abstracts Views on Vision4Press platform.
Data correspond to usage on the plateform after 2015. The current usage metrics is available 48-96 hours after online publication and is updated daily on week days.
Initial download of the metrics may take a while.