Fig. 5
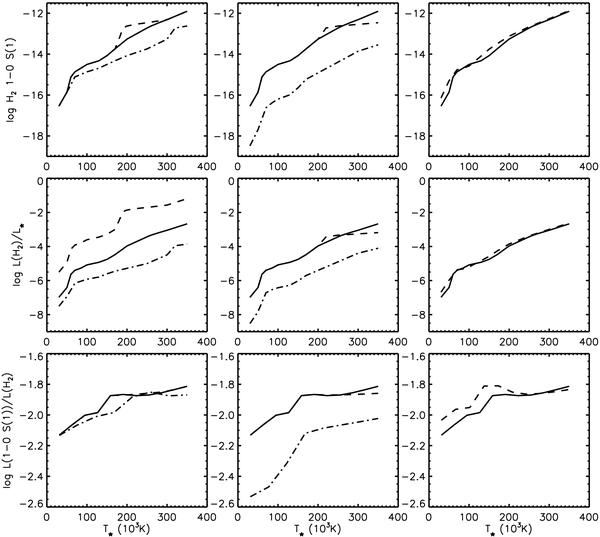
Flux of the 1–0 S(1) line in arbitrary units (top row panels), ratio of the total H2 IR lines luminosity to the central star luminosity (middle), and 1–0 S(1) luminosity to total H2 IR lines luminosity ratio (bottom) as a function of T ⋆ . Curves for different L ⋆ , nH, and Md/Mg are shown, respectively, in the left, middle, and right panels in each row. The line styles are the same as in Fig. 2. In the bottom left panel, the curves for L ⋆ = 100 and 3000 L⊙ coincide. The standard PN values are adopted for the parameters not mentioned.
Current usage metrics show cumulative count of Article Views (full-text article views including HTML views, PDF and ePub downloads, according to the available data) and Abstracts Views on Vision4Press platform.
Data correspond to usage on the plateform after 2015. The current usage metrics is available 48-96 hours after online publication and is updated daily on week days.
Initial download of the metrics may take a while.