Fig. 6
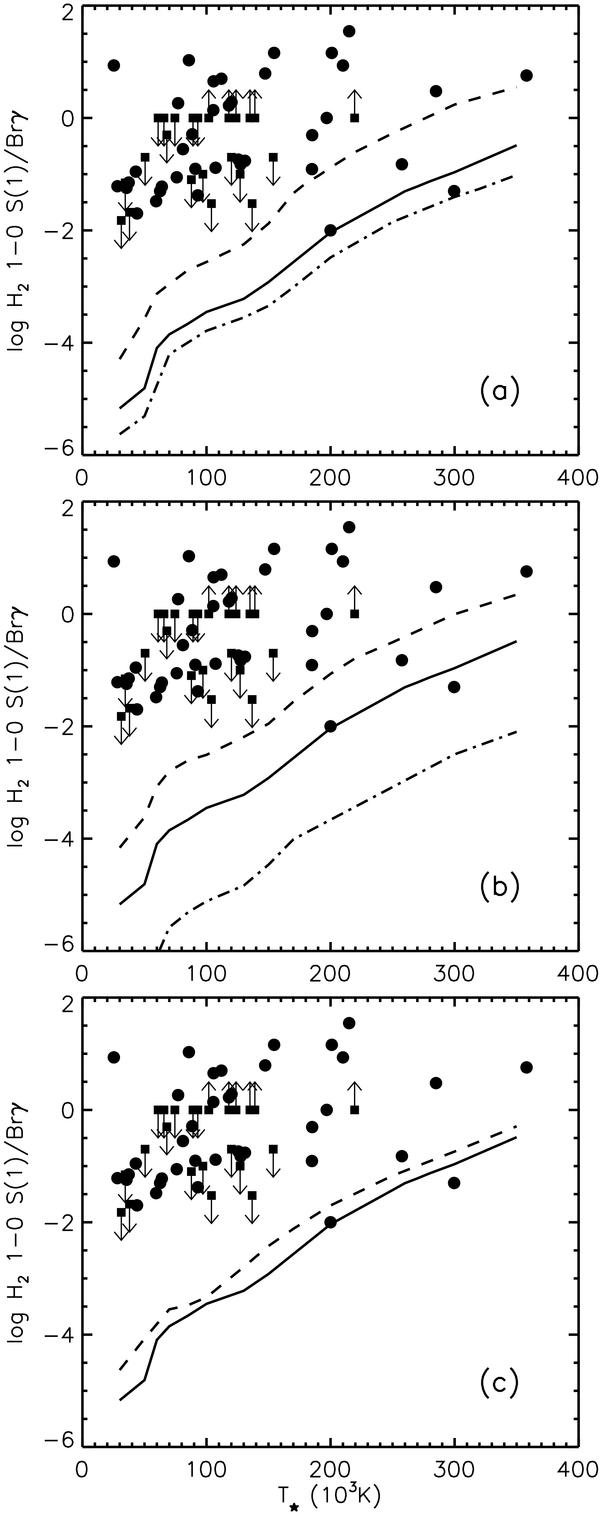
Line intensity ratio of H2 1–0 S(1) to Brγ for the ionized region as a function of T ⋆ . Curves for different a) L ⋆ , b) nH, and c) Md/Mg are shown. The line styles are the same as in Fig. 2. Observed ratios are represented by dots. Boxes with up arrows are lower limits and with down arrows are upper limits. References for the observations are given in the text. The standard PN values are adopted for the parameters not mentioned.
Current usage metrics show cumulative count of Article Views (full-text article views including HTML views, PDF and ePub downloads, according to the available data) and Abstracts Views on Vision4Press platform.
Data correspond to usage on the plateform after 2015. The current usage metrics is available 48-96 hours after online publication and is updated daily on week days.
Initial download of the metrics may take a while.