Fig. 8
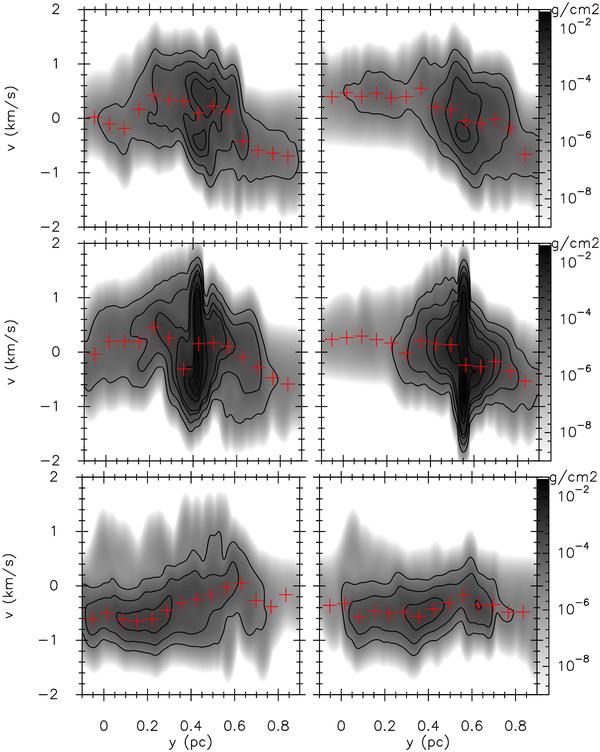
Position-velocity diagrams in colour scale and contours, at z = 0.16 pc (top), z = −0.06 pc (middle) and z = −0.30 pc (bottom) for the turbulent direct and offset runs, AT and BT, left and right respectively. The contour levels and red crosses are as in Fig. 6. As expected from Fig. 6, the velocities are more complex in the A run than the observed ones. The top panels show that the direct collision (left) produces two velocity components in the northern part of the cloud, whereas the offset collision B (right) and the observations only show one (Fig. 2). From the middle and lower panels, the differences are less obvious, but the middle panel shows that the direct collision exhibits a more “messy” velocity structure rather than a clear transition from high to low velocities.
Current usage metrics show cumulative count of Article Views (full-text article views including HTML views, PDF and ePub downloads, according to the available data) and Abstracts Views on Vision4Press platform.
Data correspond to usage on the plateform after 2015. The current usage metrics is available 48-96 hours after online publication and is updated daily on week days.
Initial download of the metrics may take a while.