Open Access
Fig. 2
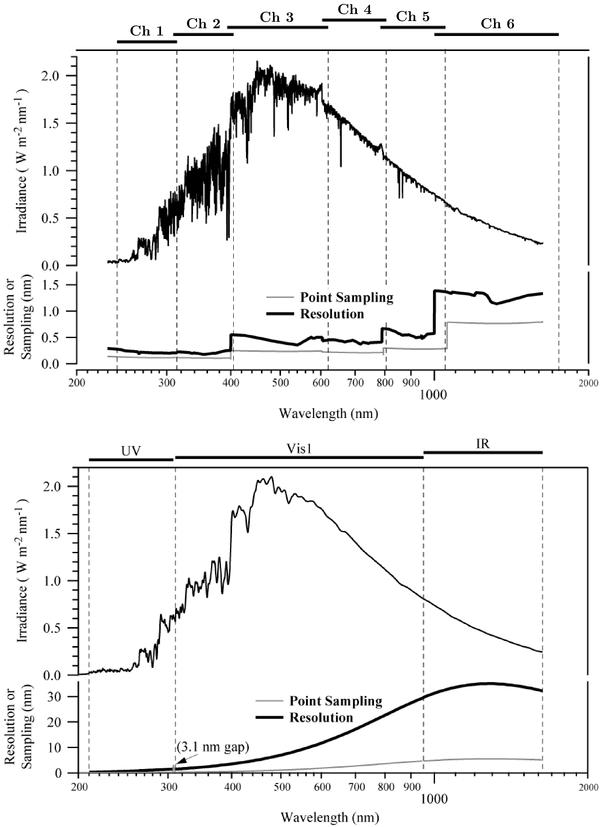
Sample UV/vis-NIR solar spectra from SCIAMACHY (top) and SIM (bottom). Both spectra are taken on April 21, 2004. Listed in each panel are channels (SCIAMACHY) or spectral (SIM) bands, point sampling and spectral resolution. Boundaries between channels or bands are indicated by vertical dashed lines.
This figure is made of several images, please see below:
Current usage metrics show cumulative count of Article Views (full-text article views including HTML views, PDF and ePub downloads, according to the available data) and Abstracts Views on Vision4Press platform.
Data correspond to usage on the plateform after 2015. The current usage metrics is available 48-96 hours after online publication and is updated daily on week days.
Initial download of the metrics may take a while.