Fig. 1
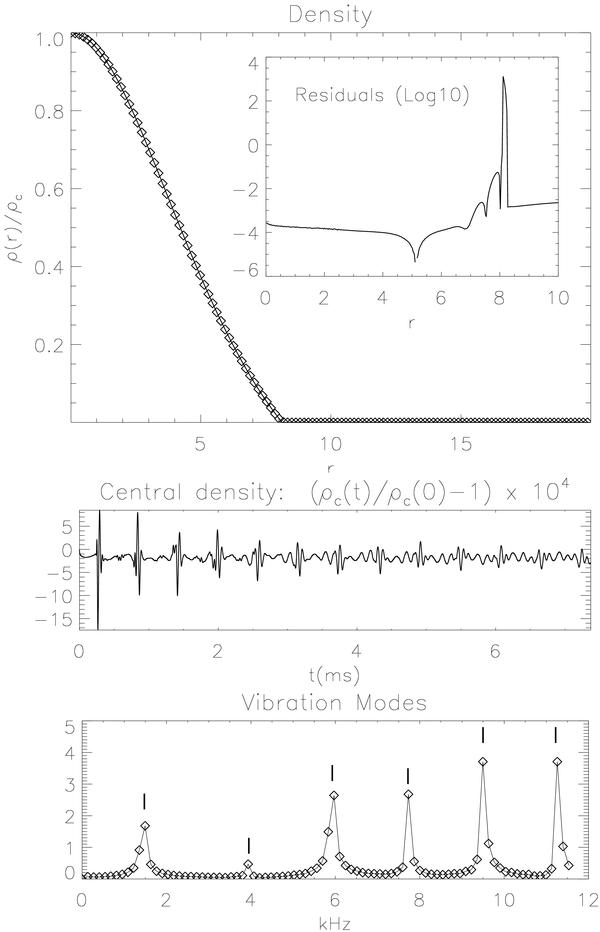
Evolution of a stable TOV solution in spherical symmetry and isotropic coordinates. The upper panel shows a comparison between density in the initial solution (solid line) and the result at tmax = 1500 (diamonds). For clarity the result a tmax is shown every 5 points. The insert shows the residuals. The spike at r ≈ 8 comes from to diffusive relaxation at the NS boundary. The middle panel shows the relative variations in time of the central density. The lower panel shows the Fourier transform of the central density. The solid line and diamonds indicate the power of the Fourier series in arbitrary units. The vertical markers indicate the frequency of known eigenmodes. The frequency resolution of our time series is ~150 Hz.
Current usage metrics show cumulative count of Article Views (full-text article views including HTML views, PDF and ePub downloads, according to the available data) and Abstracts Views on Vision4Press platform.
Data correspond to usage on the plateform after 2015. The current usage metrics is available 48-96 hours after online publication and is updated daily on week days.
Initial download of the metrics may take a while.