Fig. 6
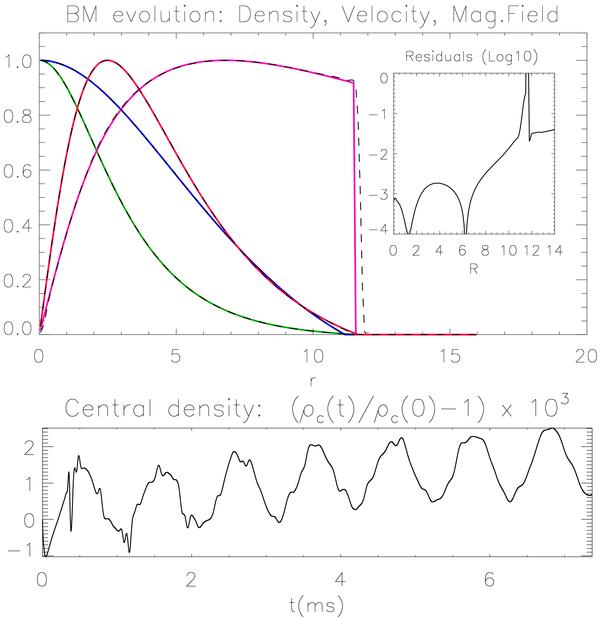
Evolution of a stable magnetized solution. The upper panel shows a comparison between the initial profiles (solid lines) of the equatorial (green) and axial (blue) densities, the equatorial rotational velocity v (magenta) and toroidal magnetic field B (red), and the value of the same quantities at at t = 1500 (dashed lines). Densities are normalized to the initial central value, velocity to its maximum (0.09810) initial value, and magnetic field to its maximum initial value too. The insert shows the relative difference between the equatorial densities as a function of radius. The spike at r ≈ 12 is due to diffusive relaxation at the boundary between the high density star and low density atmosphere. The lower panel shown the variation in time of the central density, at θ = π/2.
Current usage metrics show cumulative count of Article Views (full-text article views including HTML views, PDF and ePub downloads, according to the available data) and Abstracts Views on Vision4Press platform.
Data correspond to usage on the plateform after 2015. The current usage metrics is available 48-96 hours after online publication and is updated daily on week days.
Initial download of the metrics may take a while.