Fig. 5
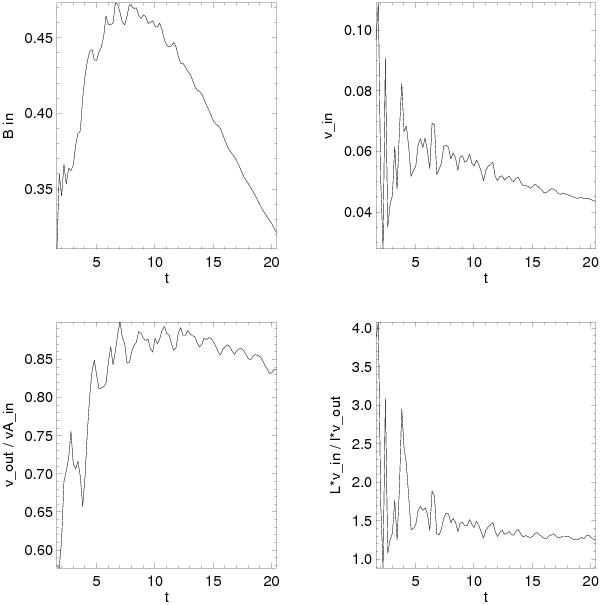
The time evolution of the magnetic field in the inflow region (top left), the plasma inflow velocity (top right), the outflow velocity relative to the Alfvén velocity in the inflow region and the ratio between the inflow (lower left) and outflow velocities and sheet dimensions defined by L vin/(l vout) (lower right). For the run C3.
Current usage metrics show cumulative count of Article Views (full-text article views including HTML views, PDF and ePub downloads, according to the available data) and Abstracts Views on Vision4Press platform.
Data correspond to usage on the plateform after 2015. The current usage metrics is available 48-96 hours after online publication and is updated daily on week days.
Initial download of the metrics may take a while.