Free Access
Fig. 6
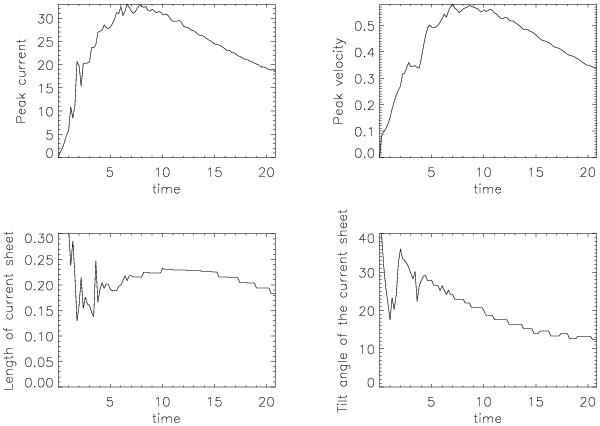
The four panels show the time evolution of the peak value of the current in the sheet (top left), the peak velocity of the reconnection jet (top right), the length of the current sheet (lower left) and finally its angle relative to the y-axis (lower right), for the run C3.
Current usage metrics show cumulative count of Article Views (full-text article views including HTML views, PDF and ePub downloads, according to the available data) and Abstracts Views on Vision4Press platform.
Data correspond to usage on the plateform after 2015. The current usage metrics is available 48-96 hours after online publication and is updated daily on week days.
Initial download of the metrics may take a while.