Fig. 5
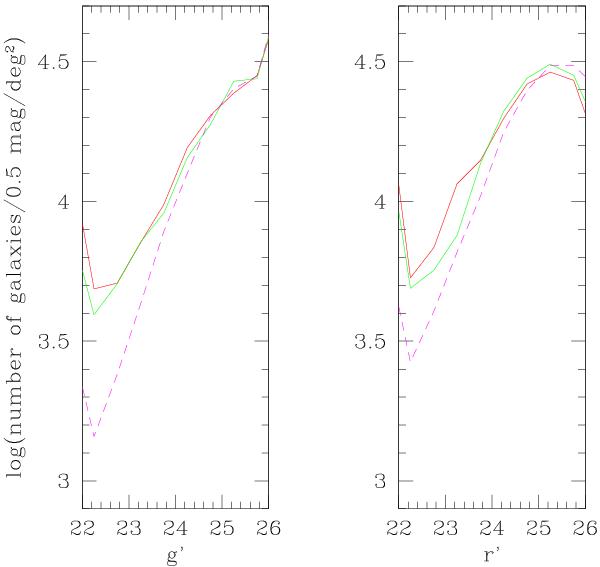
Galaxy counts in the g′ (left) and r′ (right) bands for magnitudes r′ > 22 where the background must be subtracted statistically, in logarithmic scale. The counts in Abell 1758 North and South are drawn in red and green respectively. The magenta dashed lines show the galaxy counts from the “local” background extracted in the annulus shown in Fig. 2. Error bars are Poissonian and are not plotted for clarity.
Current usage metrics show cumulative count of Article Views (full-text article views including HTML views, PDF and ePub downloads, according to the available data) and Abstracts Views on Vision4Press platform.
Data correspond to usage on the plateform after 2015. The current usage metrics is available 48-96 hours after online publication and is updated daily on week days.
Initial download of the metrics may take a while.