Fig. 3
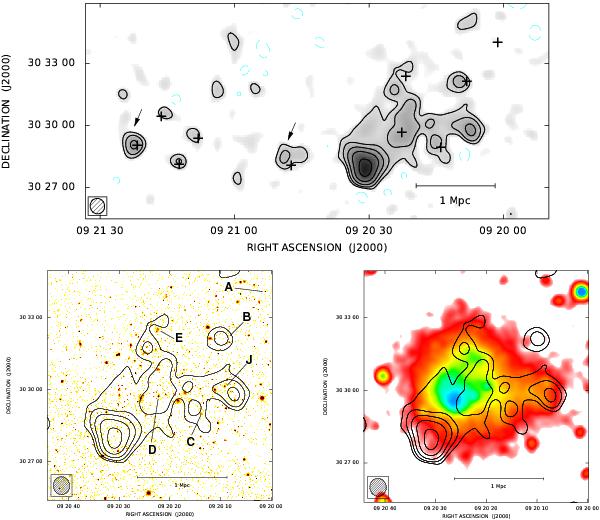
Top: total intensity radio contours at 1400 MHz with the VLA in D configuration after subtraction of discrete sources. The image has a FWHM of 42′′ × 45′′ (PA = 10.3°). The contour levels are drawn at −0.3 (thin-dashed lines), 0.3 mJy beam-1, and the rest are spaced by a factor of 2. The sensitivity (1-σ) is 0.1 mJy beam-1. Crosses indicate the positions of the subtracted discrete sources. Arrows indicate hints of possible diffuse emission left after the subtraction process. Bottom (left): zoom of the “Main” cluster in which the total intensity radio contours are overlaid on the red plate of the Sloan Digital Sky Survey. Bottom (right): zoom of the “Main” cluster in which the total intensity radio contours are overlaid on the XMM X-ray image.
Current usage metrics show cumulative count of Article Views (full-text article views including HTML views, PDF and ePub downloads, according to the available data) and Abstracts Views on Vision4Press platform.
Data correspond to usage on the plateform after 2015. The current usage metrics is available 48-96 hours after online publication and is updated daily on week days.
Initial download of the metrics may take a while.