Fig. 2
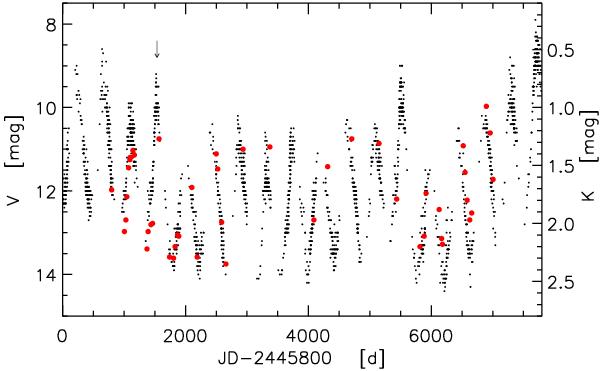
Light variations of the C-type Mira RU Vir in the visual (AAVSO data; black dots) and in the K-band (adopted from Whitelock et al. 2006; red points). The arrow marks JD 2 447 336 which was determined to be a maximum phase (φv = 0) from the AAVSO data and then adopted to estimate phases for the NIR data (see text). On top of the regular variation some long-term trend can be recognised (cf. Fig. 2b in Mattei 1997).
Current usage metrics show cumulative count of Article Views (full-text article views including HTML views, PDF and ePub downloads, according to the available data) and Abstracts Views on Vision4Press platform.
Data correspond to usage on the plateform after 2015. The current usage metrics is available 48-96 hours after online publication and is updated daily on week days.
Initial download of the metrics may take a while.