Fig. 4
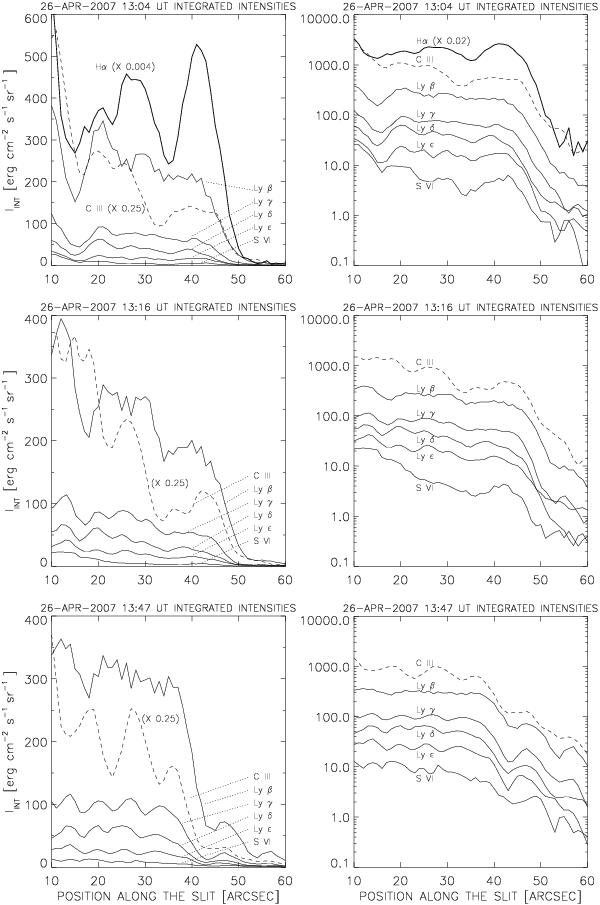
Comparison of the calibrated integrated intensities of spectral lines emitted by the prominence. These intensities are plotted along the SoHO/SUMER slit for the part crossing the prominence (10−60″). The X-axis shows the position in arcsec along the SoHO/SUMER slit. We present the plots in linear scale to see the ratios of the intensities (left column) correctly and in logarithmic scale to better see the correlations between the curves (right column). Lyβ, Lyγ, Lyδ, Lyϵ, Ciii, and Sivi are obtained from SoHO/SUMER data. The Hα line was observed with Meudon/MSDP at 12:47 UT and is plotted with the SoHO/SUMER data only form 13:04 UT. The three raws correspond to different times of the SoHO/SUMER observations. For the Hα and Ciii lines (in linear plots) we used a scaling factor to properly place the curves within the graph.


Current usage metrics show cumulative count of Article Views (full-text article views including HTML views, PDF and ePub downloads, according to the available data) and Abstracts Views on Vision4Press platform.
Data correspond to usage on the plateform after 2015. The current usage metrics is available 48-96 hours after online publication and is updated daily on week days.
Initial download of the metrics may take a while.