Fig. 4
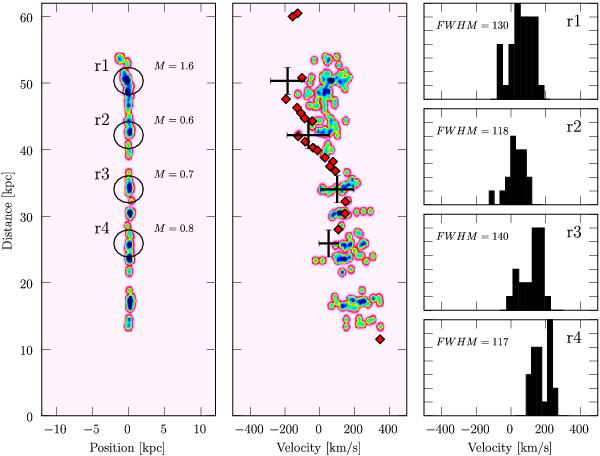
Northern filament: comparison of the model with the observations. Left: contours are the surface density of molecular gas, predicted from the model. CO(2–1) beamwidths and positions are shown by black circles. Gas masses in each beam, predicted from the model, are in units of 108 M⊙. Middle: position-velocity diagram. Pink and blue isophotes in the colour map are the model predictions. Black crosses are CO(2–1) observations. Horizontal bars are the FWHM line widths. Red diamonds are Hα data (Hatch et al. 2006). Right: velocity distribution of the gas extracted from each region of the model. The predicted FWHM line widths of the distributions are in km s-1.
Current usage metrics show cumulative count of Article Views (full-text article views including HTML views, PDF and ePub downloads, according to the available data) and Abstracts Views on Vision4Press platform.
Data correspond to usage on the plateform after 2015. The current usage metrics is available 48-96 hours after online publication and is updated daily on week days.
Initial download of the metrics may take a while.