Fig. 1
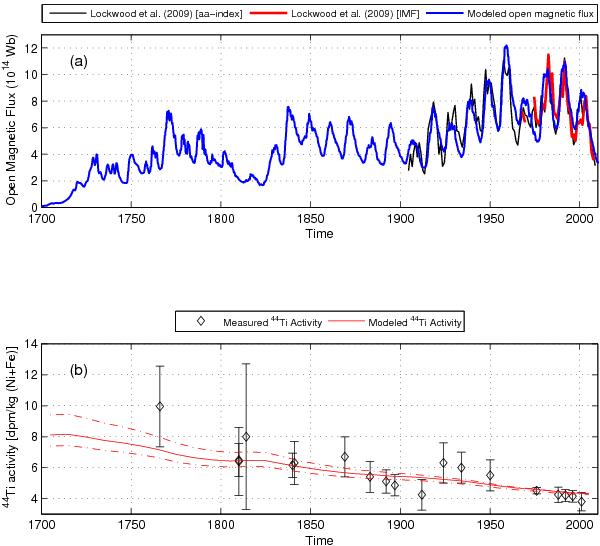
a) Evolution of the solar open magnetic flux. The black and red lines present the estimates of the open flux from the geomagentic aa-index and from observations of the interplanetary magnetic field (Lockwood et al. 2009a,b), respectively. The blue line displays the modeled open flux from SATIRE-T. b) 44Ti activity in stony meteorites as a function of the time of fall (see Taricco et al. 2006, and references therein). Error bars refer to 1-sigma uncertainties. The red line corresponds to the modeled 44Ti based on the SATIRE-T open flux according to Usoskin et al. (2006b). The 44Ti activity is given in disintegrations per minute per kilogram (dpm kg-1) of Ni + Fe. The dashed red lines correspond to the estimated 1-sigma uncertanty of the model.
Current usage metrics show cumulative count of Article Views (full-text article views including HTML views, PDF and ePub downloads, according to the available data) and Abstracts Views on Vision4Press platform.
Data correspond to usage on the plateform after 2015. The current usage metrics is available 48-96 hours after online publication and is updated daily on week days.
Initial download of the metrics may take a while.