Fig. 3
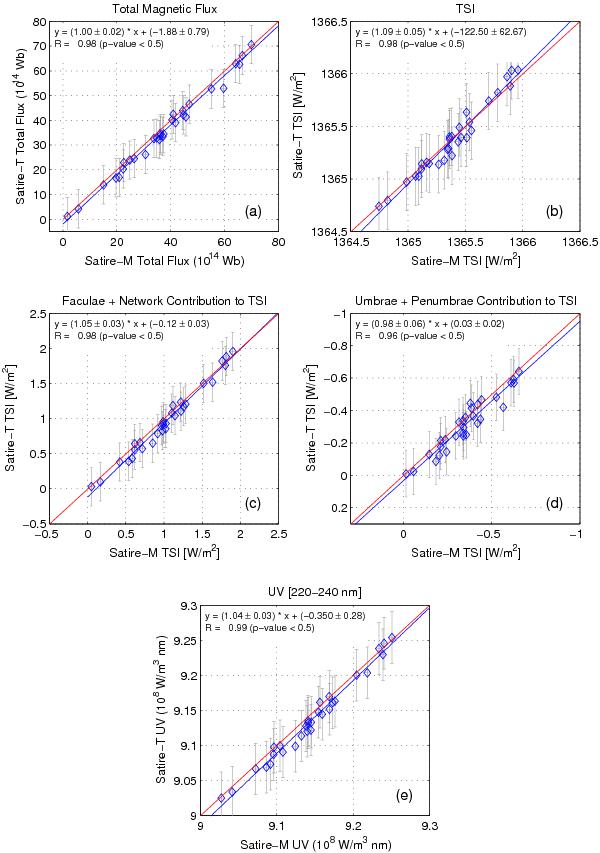
Comparison between 10-year averaged values of the parameters computed employing the SATIRE-M and SATIRE-T models from 1700 AD to 2000 AD. The following scatter plots are presented: a) total magnetic flux; b) total solar irradiance; c) contribution of the bright components (faculae + network) to the total solar irradiance; d) sunspot (umbra + penumbra) contribution to TSI; e) UV integrated in the range 220−240 nm. The red lines present the set of expectation values for the models and the blue lines are the best linear fits. The correlation coefficient and the coefficients of the linear regression are presented in the panels.
Current usage metrics show cumulative count of Article Views (full-text article views including HTML views, PDF and ePub downloads, according to the available data) and Abstracts Views on Vision4Press platform.
Data correspond to usage on the plateform after 2015. The current usage metrics is available 48-96 hours after online publication and is updated daily on week days.
Initial download of the metrics may take a while.