Fig. 8
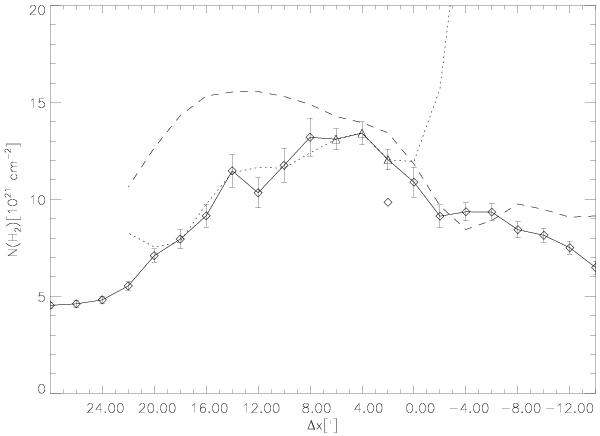
Column densities for H2 along the TMC-1 filament. The dashed line represents molecular hydrogen column densities calculated with Eq. (3) while assuming a constant dust temperature of Td ≈ 11.0 K. The diamonds represent N(H2) values derived from a NICER extinction map as described in the beginning of Sect. 3.3. The triangles and the dotted line represent N(H2) values calculated by using variable dust temperatures obtained from Eq. (7).
Current usage metrics show cumulative count of Article Views (full-text article views including HTML views, PDF and ePub downloads, according to the available data) and Abstracts Views on Vision4Press platform.
Data correspond to usage on the plateform after 2015. The current usage metrics is available 48-96 hours after online publication and is updated daily on week days.
Initial download of the metrics may take a while.