Fig. 1
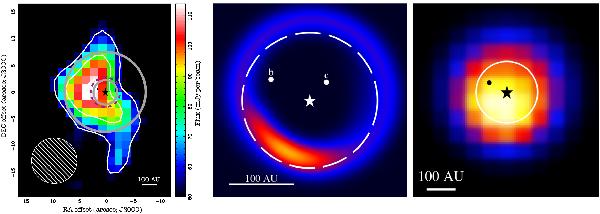
(left) The CSO 350 μm image with the positions of the star (black star) and outermost planet (dot) indicated. The solid circles trace the locations of the inner and outer edge of the Kuiper belt used in the SED model and the dashed line shows the expected position of the 2:1 resonance. (middle) The disk surface density map from the simulation. The semi-major axis centres around the 2:1 resonance with the outer planet (dashed line), and the moderate eccentricities (~0.3) of the dust grains explain their displacement from the circular path. (right) The same numerical simulation convolved with an 8 5 Gaussian to compare with the brightness peak position in the CSO map of the same resolution. The 2:1 resonance is indicated by the white line.
Current usage metrics show cumulative count of Article Views (full-text article views including HTML views, PDF and ePub downloads, according to the available data) and Abstracts Views on Vision4Press platform.
Data correspond to usage on the plateform after 2015. The current usage metrics is available 48-96 hours after online publication and is updated daily on week days.
Initial download of the metrics may take a while.