Fig. 14
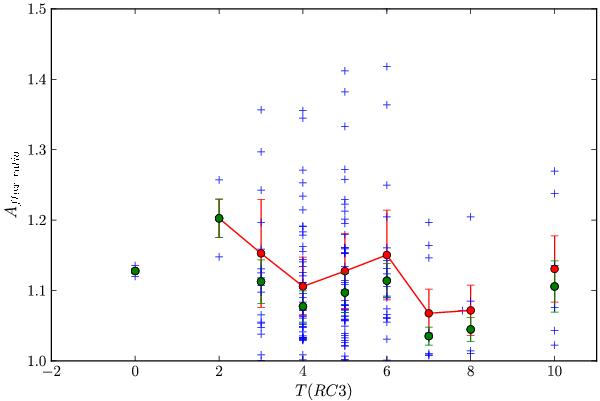
Aflux ratio and T(RC3) (Sulentic et al. 2006) for the H i refined subsample. Red points and their error-bars indicate the mean (connected by red solid line) and standard deviation, and green points the median and the median absolute deviation, for each morphological type from T(RC3) = −5 to 10 (E to Im).
Current usage metrics show cumulative count of Article Views (full-text article views including HTML views, PDF and ePub downloads, according to the available data) and Abstracts Views on Vision4Press platform.
Data correspond to usage on the plateform after 2015. The current usage metrics is available 48-96 hours after online publication and is updated daily on week days.
Initial download of the metrics may take a while.