Fig. 16
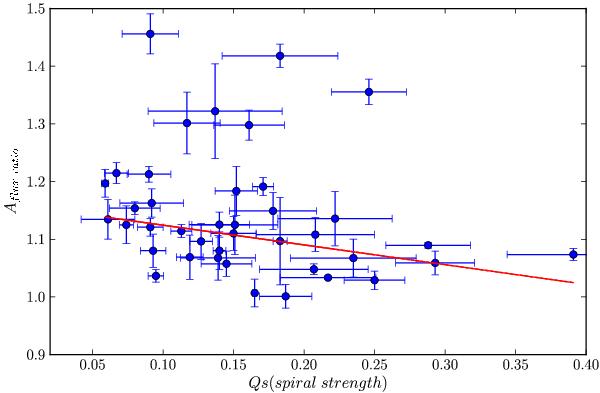
Aflux ratio versus spiral strength (Qs) for 40 CIG galaxies overlapping between the H i sample and the CIG galaxies in Durbala et al. (2009). The fit to the data points (slope and intercept are –0.34 and 1.16, Pearson’s correlation coefficient ρ = −0.45) is shown as a (red) solid line. The six outliers have been ignored in this fit.
Current usage metrics show cumulative count of Article Views (full-text article views including HTML views, PDF and ePub downloads, according to the available data) and Abstracts Views on Vision4Press platform.
Data correspond to usage on the plateform after 2015. The current usage metrics is available 48-96 hours after online publication and is updated daily on week days.
Initial download of the metrics may take a while.