Fig. 17
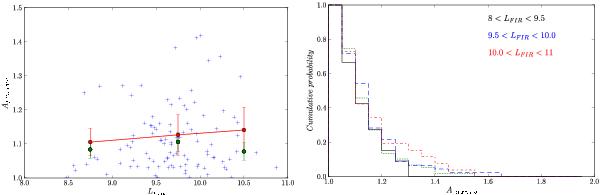
Left: Aflux ratio versus log(LFIR[L⊙]). Symbols are as in Fig. 14. Right: Aflux ratio cumulative probability distribution for three LFIR bins: 9 < log (LFIR[L⊙]) < 9.5 (solid line), 9.5 < log (LFIR [L⊙]) < 10.0 (blue dashed line) and 10.0 < log(LFIR[L⊙]) < 11.0 (dash-dotted line). The (green) dotted line represents the Aflux ratio cumulative distribution for those galaxies with an upper limit.
Current usage metrics show cumulative count of Article Views (full-text article views including HTML views, PDF and ePub downloads, according to the available data) and Abstracts Views on Vision4Press platform.
Data correspond to usage on the plateform after 2015. The current usage metrics is available 48-96 hours after online publication and is updated daily on week days.
Initial download of the metrics may take a while.