Fig. 6
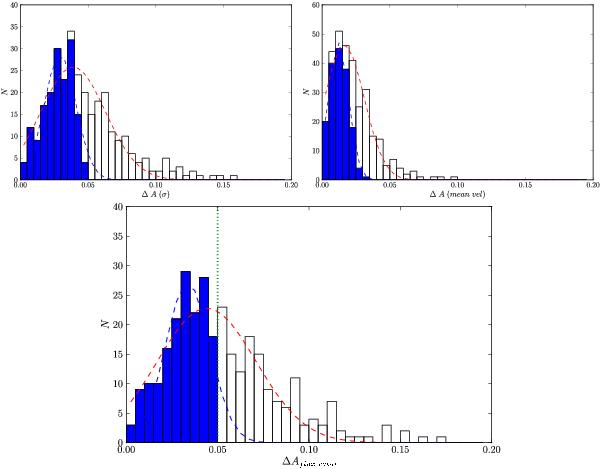
Upper right: uncertainty distribution owing to the rms of the H i profiles, ΔA(rms). Upper left: uncertainty distribution produced by errors in the mean velocity, ΔA(mean vel). Bottom: uncertainty distribution of Aflux ratio for the H i sample (N = 312) combining the effect of ΔA(rms), ΔA(mean vel) and the small contribution of ΔA (pointing offset) (See Sect. 3.2.1). The H i refined subsample (ΔAflux ratio < 0.05, indicated as a dotted line in the lower panel) is shown in the plots as blue filled histograms. Best Gaussian fits are presented for all distributions as dashed lines: for the H i sample: a) μ = 0.02, σ = 0.02; b) μ = 0.04, σ = 0.02; and c) μ = 0.04, σ = 0.03; and for the H i refined subsample: a) μ = 0.012, σ = 0.007; b) μ = 0.029, σ = 0.012; and c) μ = 0.033, σ = 0.012.

Current usage metrics show cumulative count of Article Views (full-text article views including HTML views, PDF and ePub downloads, according to the available data) and Abstracts Views on Vision4Press platform.
Data correspond to usage on the plateform after 2015. The current usage metrics is available 48-96 hours after online publication and is updated daily on week days.
Initial download of the metrics may take a while.