Fig. 8
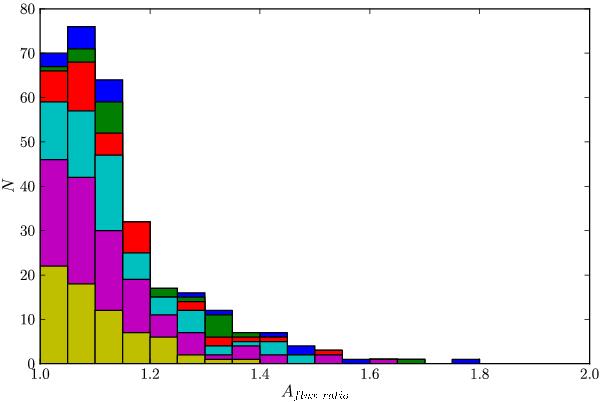
Aflux ratio distribution for the different cuts in ΔAflux ratio from 0.03 to 0.11 in bins of 0.02. Note that ΔAflux ratio < 0.05 (N = 166, purple filled histogram) corresponds to the H i refined sample (see Sect. 3.4), and the H i sample (N = 312) is the blue solid line histogram.
Current usage metrics show cumulative count of Article Views (full-text article views including HTML views, PDF and ePub downloads, according to the available data) and Abstracts Views on Vision4Press platform.
Data correspond to usage on the plateform after 2015. The current usage metrics is available 48-96 hours after online publication and is updated daily on week days.
Initial download of the metrics may take a while.