Fig. 5
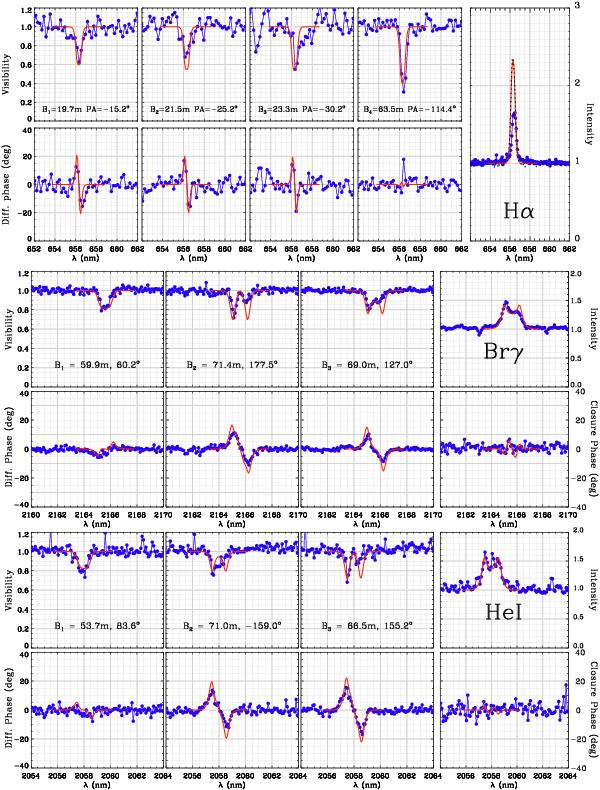
Visibility and phase variations in the Hα, Brγ, and He i emission lines obtained from the high-spectral-resolution CHARA/VEGA and VLTI/AMBER observations obtained in 2010 (blue line and circles). The best-fit kinematic-model for this dataset is over-plotted as a red line. The black dotted line (upper right figure) corresponds to an Hα profile taken from the BeSS database and used to determine the real line EW.
Current usage metrics show cumulative count of Article Views (full-text article views including HTML views, PDF and ePub downloads, according to the available data) and Abstracts Views on Vision4Press platform.
Data correspond to usage on the plateform after 2015. The current usage metrics is available 48-96 hours after online publication and is updated daily on week days.
Initial download of the metrics may take a while.