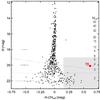
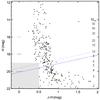
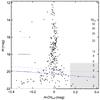
Fig. 3
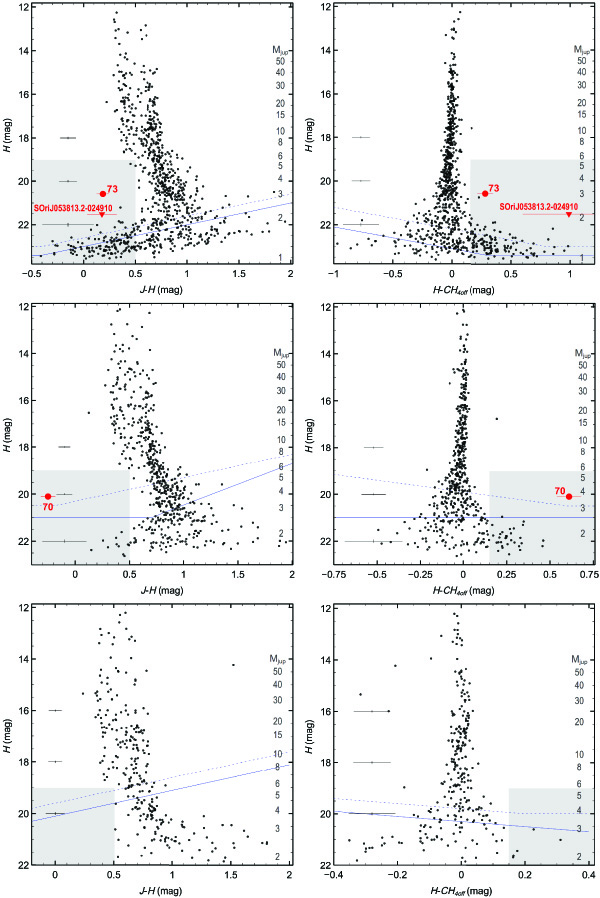
Color–magnitude diagrams resulting from the HAWK-I survey. The top panels correspond to the S Ori 73 pointing, middle panels display the field around S Ori 70, and the lower panels illustrate the photometry of the third pointing. Sources discussed in this work are plotted as red circles (S Ori 70 and 73) and with a red triangle (new T-type candidate). Completeness and limiting magnitudes are indicated by a dashed and a solid line, respectively. Our photometric criteria to select new methane candidates are shown with a gray-shaded region. Average error bars are given to the left, and masses (MJup) predicted for the age of 3 Myr are labelled on the right side of the diagrams.
Current usage metrics show cumulative count of Article Views (full-text article views including HTML views, PDF and ePub downloads, according to the available data) and Abstracts Views on Vision4Press platform.
Data correspond to usage on the plateform after 2015. The current usage metrics is available 48-96 hours after online publication and is updated daily on week days.
Initial download of the metrics may take a while.