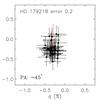
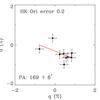
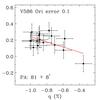
Fig. 1
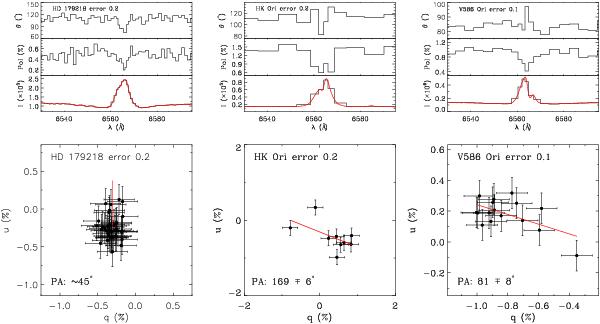
An example of the spectropolarimetric signatures of the sample. The top half of the figure presents the spectropolarimetric PA, the percentage polarisation, and the Stokes intensity spectra centred upon Hα. The data are binned to a constant polarisation error, which is stated in the plots. The solid red line is the un-binned line profile. The QU diagrams of the signatures are displayed in the lower half of the figure. The solid lines mark the direction of the intrinsic polarisation.
Current usage metrics show cumulative count of Article Views (full-text article views including HTML views, PDF and ePub downloads, according to the available data) and Abstracts Views on Vision4Press platform.
Data correspond to usage on the plateform after 2015. The current usage metrics is available 48-96 hours after online publication and is updated daily on week days.
Initial download of the metrics may take a while.