Fig. 6
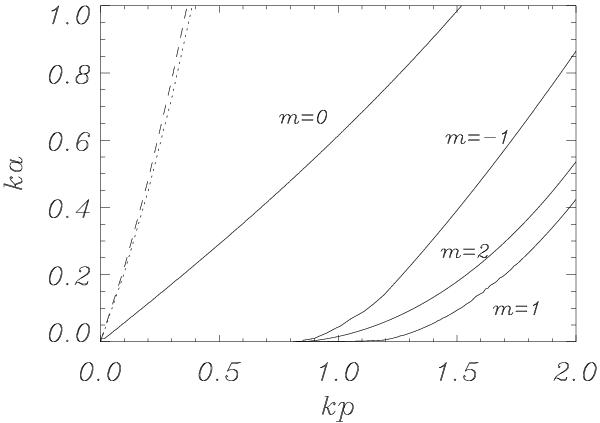
Stability diagram (χ = 15) for different values of the azimuthal
number m. The dashed line represents the threshold without flow
(Dungey & Loughhead 1954), while the
dotted line represents the threshold with a monolithic axial flow with
 (Zaqarashvili et al. 2010). Equilibrium
configurations whose parameters are above the stability lines are unstable.
(Zaqarashvili et al. 2010). Equilibrium
configurations whose parameters are above the stability lines are unstable.
Current usage metrics show cumulative count of Article Views (full-text article views including HTML views, PDF and ePub downloads, according to the available data) and Abstracts Views on Vision4Press platform.
Data correspond to usage on the plateform after 2015. The current usage metrics is available 48-96 hours after online publication and is updated daily on week days.
Initial download of the metrics may take a while.