Fig. 5
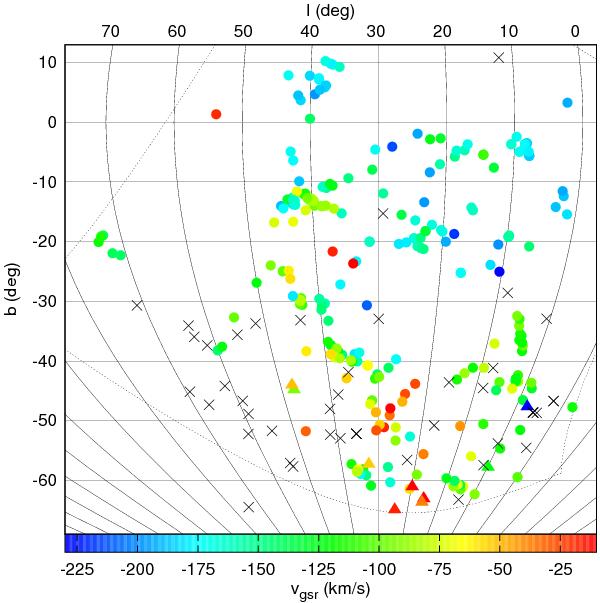
Radial velocities and spatial positions of clouds in our catalog. We additionally had access to the metal absorption line sample of Ben Bekhti et al. (2008), who searched for Ca ii and Na i gas in QSO spectra obtained with UVES/VLT; see Sect. 4.1.2. Nondetections are marked with black crosses, Ca ii detections are marked with filled triangles (velocity is color-coded). No Na i absorption lines were detected. The dotted line shows the area that we used for the analysis corresponding to the map in Fig. 1.
Current usage metrics show cumulative count of Article Views (full-text article views including HTML views, PDF and ePub downloads, according to the available data) and Abstracts Views on Vision4Press platform.
Data correspond to usage on the plateform after 2015. The current usage metrics is available 48-96 hours after online publication and is updated daily on week days.
Initial download of the metrics may take a while.