Fig. 1
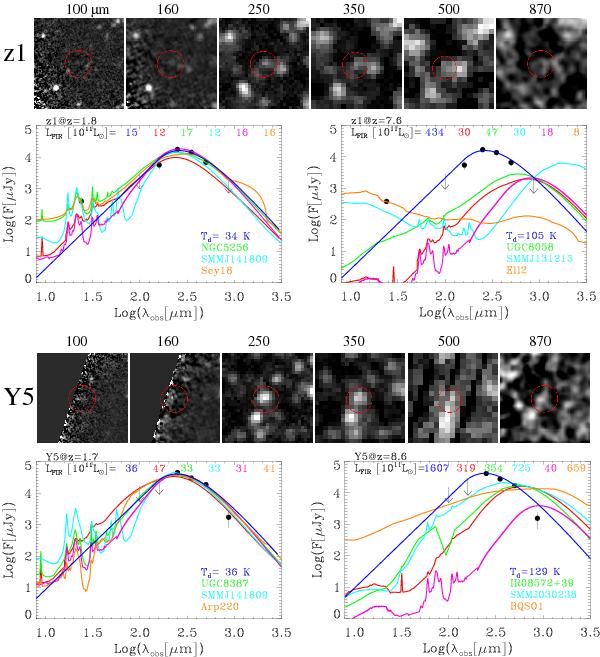
Top figures show the thumbnails in the five Herschel bands (100, 160, 250, 350, 500 μm from left to right) and the LABOCA band (870 μm, the right-most stamp) centered on z1 and the best-fit SEDs for the low-redshift (left) and high-redshift (right) solutions. The bottom figures show the same for the source Y5. The red circle in the thumbnails is meant to guide the eye, it has a radius of 27″ and is centered on the source position. The blue curves correspond to the best-fit modified black-body SEDs with the parameters written in blue, the magenta curves correspond to the SMM J2135-0102 model (Swinbank et al. 2010; Ivison et al. 2010), the other curves correspond to the best-fit templates of the Chary & Elbaz (2001) library (red), the Vega et al. (2008) library (green), the Michałowski et al. (2010a,b) library (cyan) and the Polletta et al. (2007) library (orange). The names of the best-fit templates as well as LFIR are written in the figure with the same color codes.
Current usage metrics show cumulative count of Article Views (full-text article views including HTML views, PDF and ePub downloads, according to the available data) and Abstracts Views on Vision4Press platform.
Data correspond to usage on the plateform after 2015. The current usage metrics is available 48-96 hours after online publication and is updated daily on week days.
Initial download of the metrics may take a while.