Fig. B.1
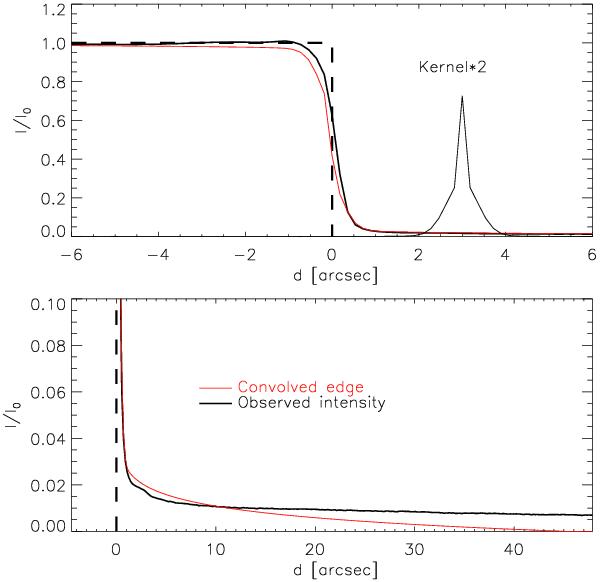
Derivation of the PSF at 777 nm. Thick black: observed intensity. Dashed: edge function. Thin red: convolved edge. Upper panel: observed intensity across the blocking edge. The convolution kernel is shown on the right; for better visibility it was multiplied by 2. Lower panel: “tail” region.
Current usage metrics show cumulative count of Article Views (full-text article views including HTML views, PDF and ePub downloads, according to the available data) and Abstracts Views on Vision4Press platform.
Data correspond to usage on the plateform after 2015. The current usage metrics is available 48-96 hours after online publication and is updated daily on week days.
Initial download of the metrics may take a while.