Fig. 6
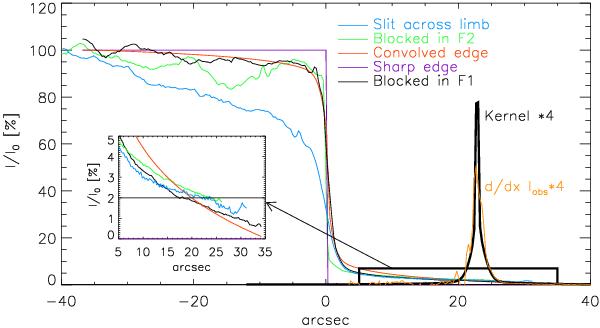
Observed intensity variation along the slit for FOV blocked in F1 (black), blocked in F2 (green), and for the slit across the limb (blue). The purple lines at x,y = (0′′,100%) denote a simulated sharp edge that after convolution with the kernel at the right yields the red curve. The inlet on the left shows a magnification of the stray-light tail region. The derivative of the observed intensity variation for the FOV blocked in F1 is overplotted over the kernel as an orange line.
Current usage metrics show cumulative count of Article Views (full-text article views including HTML views, PDF and ePub downloads, according to the available data) and Abstracts Views on Vision4Press platform.
Data correspond to usage on the plateform after 2015. The current usage metrics is available 48-96 hours after online publication and is updated daily on week days.
Initial download of the metrics may take a while.