Fig. 8
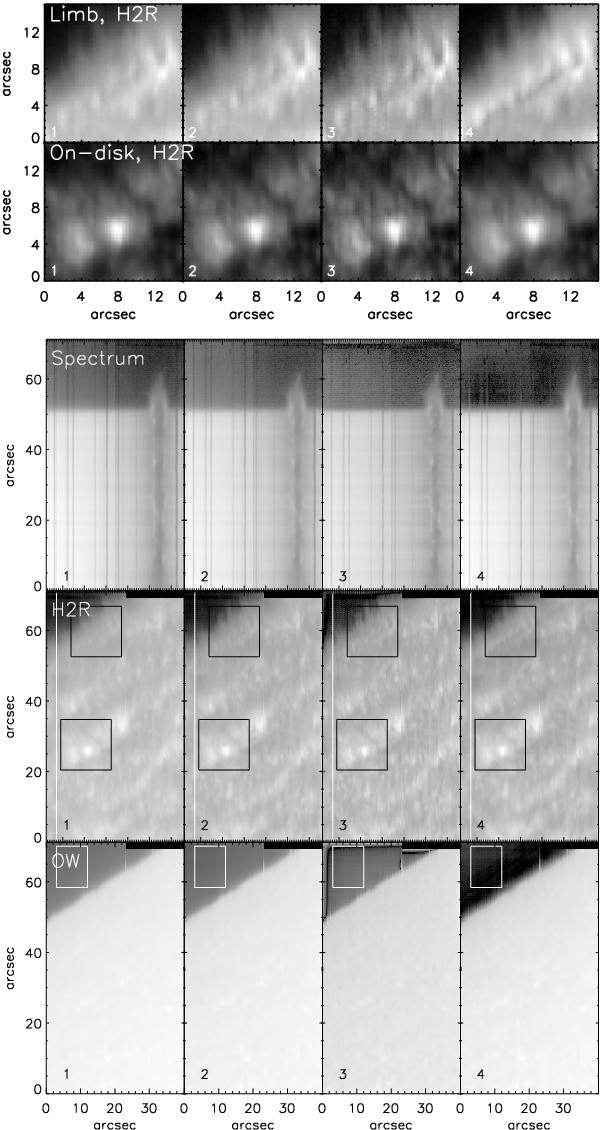
2D maps and spectra after the correction. Lower panel: OW map in logarithmic display (bottom row), H2R map (middle row), spectra (top row) along the cuts marked by white vertical lines in the H2R map. Upper panel: magnification of the areas marked by black squares in the H2R map (on-disk and at the limb). The white rectangles denote the off-limb area used to derive the profiles of Fig. 10.
Current usage metrics show cumulative count of Article Views (full-text article views including HTML views, PDF and ePub downloads, according to the available data) and Abstracts Views on Vision4Press platform.
Data correspond to usage on the plateform after 2015. The current usage metrics is available 48-96 hours after online publication and is updated daily on week days.
Initial download of the metrics may take a while.