Fig. 1
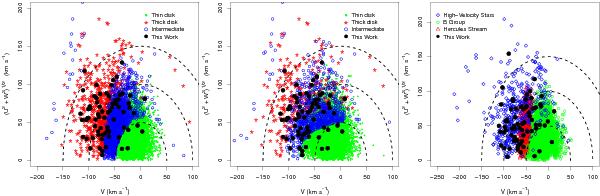
Toomre diagram of GCS stars. Left and middle panels: the thin/thick disk decomposition of GCS stars was performed using the velocity dispersions and star fractions from Soubiran et al. (2003) (left) and from Robin et al. (2003) (middle). The thin, thick, and intermediate stars of the GCS are represented by green dots, red stars, and open blue circles, respectively. The dashed lines indicate the total space velocity,  , in steps of 50 km s-1. Right panel: Toomre diagram showing the groups identified by Famaey et al. (2005): the Hercules stream (red open triangles), high-velocity stars (blue open diamonds), and B-group stars (green open circles). In all panels the present sample is indicated by black dots.


Current usage metrics show cumulative count of Article Views (full-text article views including HTML views, PDF and ePub downloads, according to the available data) and Abstracts Views on Vision4Press platform.
Data correspond to usage on the plateform after 2015. The current usage metrics is available 48-96 hours after online publication and is updated daily on week days.
Initial download of the metrics may take a while.