Fig. 6
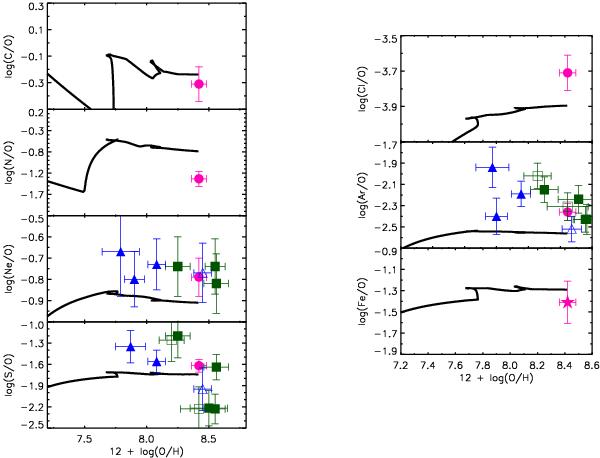
Element abundance ratios, relative to O, as predicted for model M1R compared to observed values from recombination lines for the H ii region HV as presented in Peimbert et al. (2005) and the adopted values for PNe, as explained in Sect. 5.1. O and C abundances in HV was corrected for dust depletion, as explained in Sect. 4.1. H ii region HV is presented in magenta filled circles, young-PNe are represented by green filled squares and old-PNe, by blue filled triangles. The open squares are the two type-I PNe and the open triangle is PN6 (see HPCG09). The magenta filled star, in the Fe/O panel, represents the value derived by Venn et al. (2001) for A-type supergiant stars.
Current usage metrics show cumulative count of Article Views (full-text article views including HTML views, PDF and ePub downloads, according to the available data) and Abstracts Views on Vision4Press platform.
Data correspond to usage on the plateform after 2015. The current usage metrics is available 48-96 hours after online publication and is updated daily on week days.
Initial download of the metrics may take a while.