Fig. 8
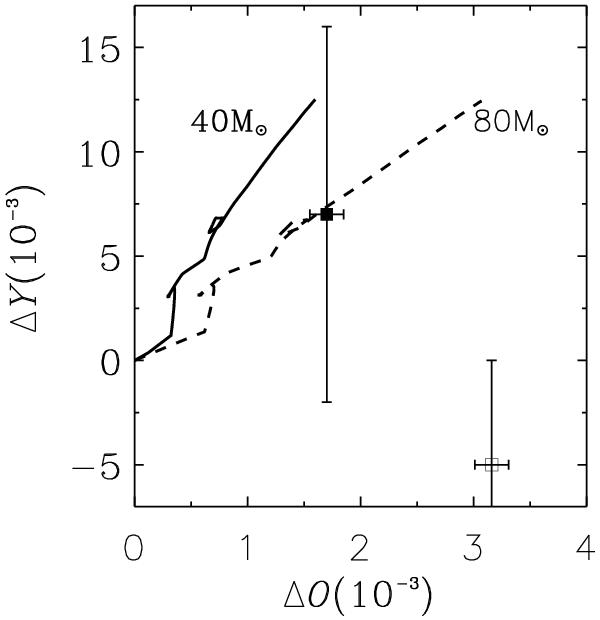
Evolution of ΔY vs. ΔO for our two best models, M4C (solid line) and M1R (dashed line). The black square represents observed abundances under the assumption of constant temperature, and the open square represents abundances from RLs under the assumption of temperature variations (Peimbert et al. 2005), note that the observed ΔY values might be lower limits due to the possible presence of neutral helium inside the H ii region.
Current usage metrics show cumulative count of Article Views (full-text article views including HTML views, PDF and ePub downloads, according to the available data) and Abstracts Views on Vision4Press platform.
Data correspond to usage on the plateform after 2015. The current usage metrics is available 48-96 hours after online publication and is updated daily on week days.
Initial download of the metrics may take a while.