Free Access
Fig. 12
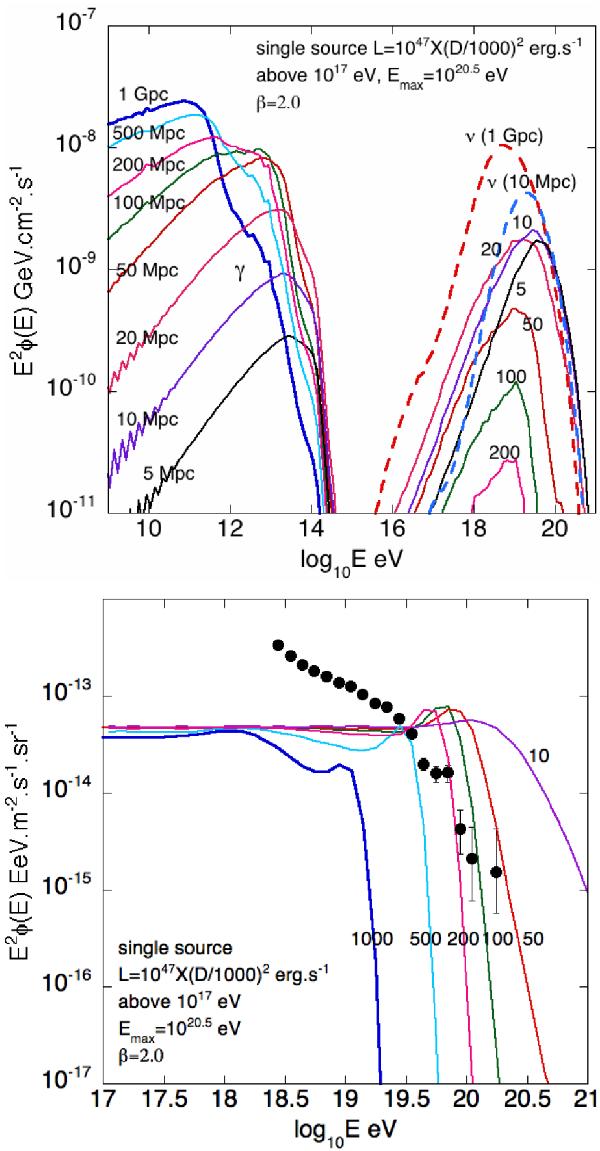
Same as in Fig. 11 assuming sources located at various distances D = 5, 10, 20, 100, 200, 500, 1000 Mpc and luminosity of 1047 × (D/1000Mpc)2 erg s-1. The top panel shows the photons and neutrino fluxes, the bottom panel the spectra compared with the Pierre Auger Observatory data. Only the pure proton case is considered.
This figure is made of several images, please see below:
Current usage metrics show cumulative count of Article Views (full-text article views including HTML views, PDF and ePub downloads, according to the available data) and Abstracts Views on Vision4Press platform.
Data correspond to usage on the plateform after 2015. The current usage metrics is available 48-96 hours after online publication and is updated daily on week days.
Initial download of the metrics may take a while.